Global Groundwater Demands

Declining Groundwater Tables

Arnaud Sterckx, researcher at IGRAG

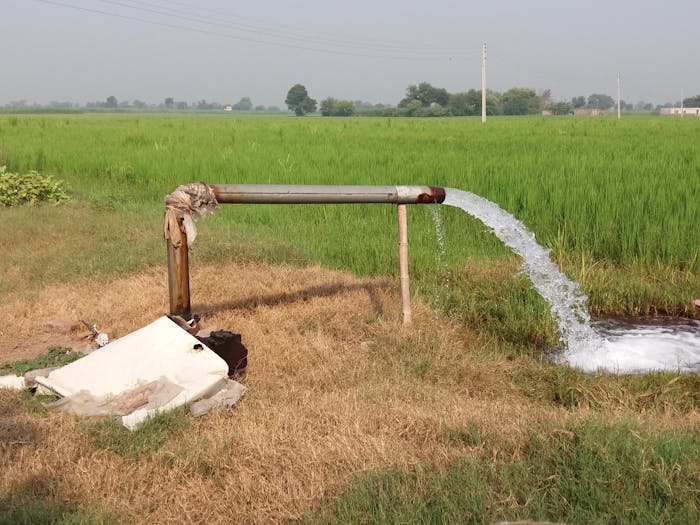
Scholar: ‘I love maps and was preparing for my “show and tell” on groundwater, our invisible water resource. I found global maps showing declining groundwater tables. How do they know? In which countries is it the most extreme?’

During wet periods, surface water is often prioritized as a source for irrigation water due to its availability and relatively low cost. However, during dry periods, irrigation comes primarily from groundwater sources. Additional wells are often installed to meet irrigation demand. When the wet period returns, groundwater levels increase, yet global trends show that they do not recover to their pre-dry periods due to continued use of the additional wells. An example of this is increased groundwater use and decline in California.

Declining groundwater table in California

Created in partnership with: International Groundwater Resources Assessment Centre

Increase of Global Water Demand

Arnaud Sterckx, researcher at IGRAG

Global water demand more than doubled between 1960 and 2000, and is expected to continue increasing, mostly due to increased irrigation demand for global food demand. Global demand for surface and groundwater in 2000 is presented in the figure below.

Wada et al., HESS, 2011

Created in partnership with: International Groundwater Resources Assessment Centre

Research of Declining Groundwater Tables

Arnaud Sterckx, researcher at IGRAG

Many methods exist, such as site-specific monitoring, modelling, and by using globally available information, such as remote sensing data.

For instance, the Gravity Recovery and Climate Experiment (GRACE) mission has provided valuable insights into regional groundwater depletion in areas such as India and California. In a study led by the University of California, Irvine (UCI) published in 2015, researchers concluded that 21 of the world’s 37 largest aquifers “have exceeded sustainability tipping points and are being depleted” with 13 that are “considered significantly distressed, threatening regional water security and resilience”.

Based on global datasets, numerical models have been developed to cover most of the world. An example of this is PCR-GLOBWB, developed by Utrecht University in the Netherlands. The consumption of groundwater and surface water per sector (irrigation, livestock, industry, and households) is produced from the model. Combining model outputs, such as subtracting groundwater recharge from groundwater abstractions provides valuable insights into areas where high groundwater depletion can be expected, as in the figure below (Wada et al., GRL, 2012). These results corroborate observed data above, indicating that some of the highest depletion is located in India, Pakistan, the USA, Iran, China, Saudi Arabia, and Mexico.

Wada et al., HESS, 2011

Global Groundwater Footprint

Arnaud Sterckx, researcher at IGRAG

Research using the computer model PCR-GLOBWB, developed by Utrecht University, shows that the global groundwater footprint to be 3.5 times the global area (Gleeson et al., Nature, 2012). This shows that there is extreme groundwater stress on aquifers such as the ones in Western Mexico, Northern Arabia, and the Upper Ganges.

Improved monitoring and modelling will continue to provide better insights to policy and decision makers so that they can implement appropriate measures to ensure sustainable use of both groundwater and surface water resources while meeting water demand.

Gleeson et al., Nature, 2012